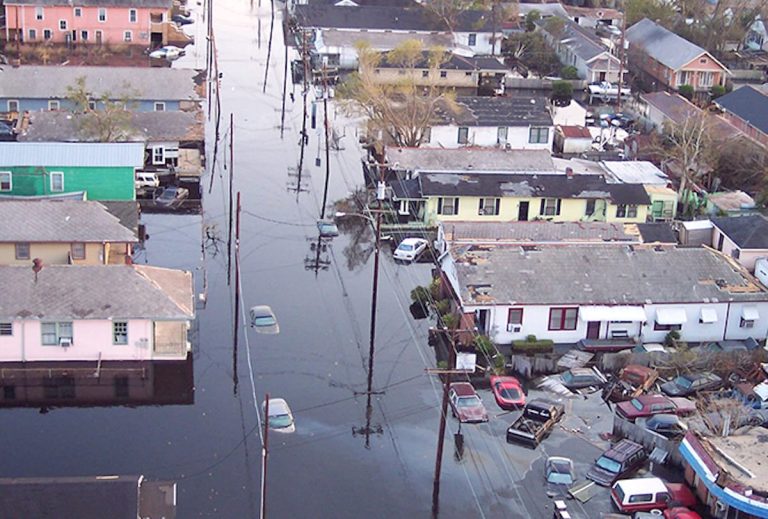
Doomsayers immediately saw the devastation caused by hurricanes Helen and Milton as “evidence” of climate change. [emphasis, links added]
It's the latest example of an increasingly common phenomenon: attribution to individual weather events— Flooding in Vermont, heat waves in the Pacific Northwest, cold snaps in Texas and many others —climate change.
Linking individual weather events that have occurred since ancient times to long-term changes in climate has given rise to a new academic field called attribution science.
However, since it is impossible to prove that a specific weather event is the result of human-caused climate change, it is impossible to prove that a specific weather event is the result of human-caused climate change. Attribution science uses old-fashioned statistical tricks to link human-caused climate change to individual events.
The first example of attribution science dates back 20 years to an academic paper that sought to show that the 2003 European heat wave was linked to climate change. Doing so has now become routine.
A European organization called World Weather Attribution now provides near-instantaneous analysis of global weather events, nearly all of which are caused or exacerbated by the burning of fossil fuels.
Attribution science uses climate models to determine the statistical likelihood of a single event in the absence of anthropogenic climate change (i.e., without greenhouse gas emissions from fossil fuels and agriculture).
This counterfactual possibility is then compared to observed probabilities of similar events. This approach is the same “but-for” analysis that lawyers often use when proving damages in business litigation cases.
For example, climate models might determine the likelihood of catastrophic floods, such as the one that devastated Montpelier, Vermont, in July 2023, occurring once every 500 years.
This value is compared to the observed probability, say once every 100 years. (Montpellier’s last major flood occurred in 1927.)
The ratio of these two values (in this case 0.20) is used to calculate the “fraction of attributable risk”, which is 1 minus the ratio, which is 80%.
in other words, 80% of the increased risk of severe flooding in Montpellier can be attributed to human-caused climate change.
For annual events like hurricanes, a slightly different approach is used.
Since there is no evidence that the number of hurricanes has increased over the past century or longer, instead of estimating the likelihood of changes in the number of hurricanes, we estimate the likelihood of changes in the severity of hurricanes.
However, Severity is an imprecise concept. Although hurricane severity is measured in terms of wind speed, The physical and economic damage of a hurricane depends on many factors, including where it makes landfall, how fast it moves over land, and whether the storm surge occurs at high or low tide.
Therefore, a less intense hurricane, such as Sandy in 2012, can cause greater economic damage than a much more intense hurricane.
Statistical attribution studies rely entirely on the accuracy of climate models and their assumptions to calculate counterfactual likelihoods.
These calculations are complicated for rare events because rare events are indeed rare. therefore, There is probably little historical data to accurately estimate how often they occur, let alone using counterfactual climate models to determine frequency.
Even for more frequent events, such as hurricanes and tornadoes that the United States experiences every year, Isolating the multiple factors that may influence its severity relies on various statistical techniques.
Sixty years ago, a journalist named Darrell Huff wrote a short, humorous book titled How to Lie with Statistics, which introduced a series of statistics that could and still are used. Statistical techniques to distort reality.
He may not have foreseen the science of attribution, but he would certainly smile at its use today.
To read more, visit RealClearEnergy
