From Dr. Roy Spencer's Global Warming Blog
Dr. Roy Spencer
In a recent article, I used new urban heat island (UHI) warming estimates from various GHCN stations in the United States that have at least 120 years of data to demonstrate that homogenized (adjusted) GHCN data still contain substantial The impact of UHI. Therefore, false warming caused by the urban heat island effect is exaggerating reported warming trends in the United States.
However, there is considerable scatter in the data plots I provide, leading to concerns that there is substantial uncertainty in my quantitative estimates of the extent of urban heat island warming remaining in the GHCN data. Therefore, I updated the post to include more regression statistics.
A simple example: correlation is high, but confidence in regression slope is low
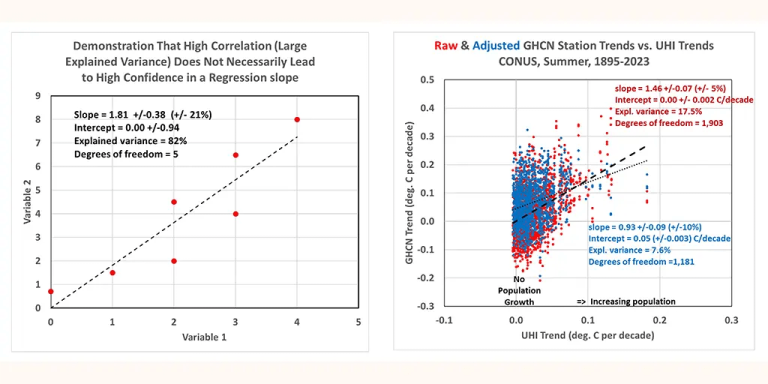
The small data plot I created below shows what appears to be a fairly strong linear relationship between the two variables, with the regression explaining 82% of the variance (correlation coefficient 0.91).

However, because there are so few data points, there is a large statistical uncertainty in the resulting diagnostic regression slope (21% uncertainty) and regression intercept (diagnosis is 0.0, but uncertainty is +/- 0.94).
Now let's look at the third data plot from my previous blog post, which shows that UHI warming is present not only in the original GHCN data, but also in the homogenized data:

Importantly, although the amount of variation explained by the regression is quite low (17.5% for the original data and 7.6% for the adjusted data), the confidence in the regression slope is quite high (+/-5% for the original GHCN regression and +/-10 % (for the homogeneous GHCN regression). The confidence in the regression intercept is also high (+/-0.002 C/decade for the original GHCN data and +/-0.003 C/decade for the homogeneous GHCN data).
Compare them to the first plot above which contains very few data points, which has a very high explained variance (82%) but a rather uncertain regression slope (+/- 21%).
The point I made in my last blog post hinged on regression SLOPES and return intercept. The positive slope indicates that the greater the population growth at the GHCN station, the greater the warming trend…not only in the raw data, but also in the homogeneous data. A regression intercept of zero indicates that if these stations experienced no population growth, the data as a whole would indicate a zero warming trend (1895-2023).
But it's important to stress that these are averages for all stations in the U.S., not regional averages. “It's possible” that in areas with greater population growth, (by chance) climate warming is actually greater. Therefore, it is premature to claim that there is no warming trend in the United States after accounting for the false urban heat island warming effect. I also show that if we look at recent data (1961-2023), we see a warming climate.
But the point of this article is to demonstrate that a low correlation between two data set variables does not necessarily mean low confidence in the regression slope (and intercept). The confidence interval also depends on how much data is included in the data set.
Relevant
