Article by Eric Worrell
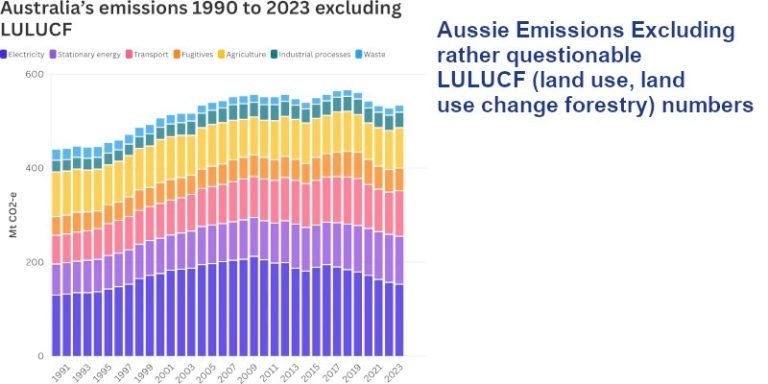
h/t Greg L. Despite claims of progress, real emissions reductions have stalled since 2020.
These six charts tell the story of Australia’s (slow) progress on climate change
By Michael Slezak, national science and environment reporter
Monday, December 9Climate Change and Energy Minister Chris Bowen recently announced that Australia was “on track” to meet its climate change targets. Shortly after the announcement, new data challenged that optimism.
As a reminder of Australia's goals – we have committed to reducing emissions by 43% below 2005 levels by 2030 and reaching net zero emissions by 2050.
In the past few weeks, the federal government has released four reports on Australia's greenhouse gas pollution, highlighting how far we are from meeting these targets.
Matt Kean, chairman of the government's independent climate change agency, also poured cold water on Mr Bowen's march, saying: “Emissions need to fall faster to meet Australia's 2030 target.”
…
The only real big cuts so far have been in the land sector – Cut down fewer trees and plant more. (In carbon reporting lingo, this is called land use, or more formally land use, land-use change and forestry (land use, land use and forestry)).
…
These numbers are actually unreliable. So much so that governments change their views on these emissions every year.
…
Find out more: https://www.abc.net.au/news/2024-12-09/australias-climate-change-policy-problem-in-charts/104689682
The methodology is revised every year, and government-funded ABC reporters question the claims. Is it possible that governments are raising emissions reduction figures simply to suit their political narrative?
Of course not, after all they are a group of green politicians committed to climate action.
Relevant
