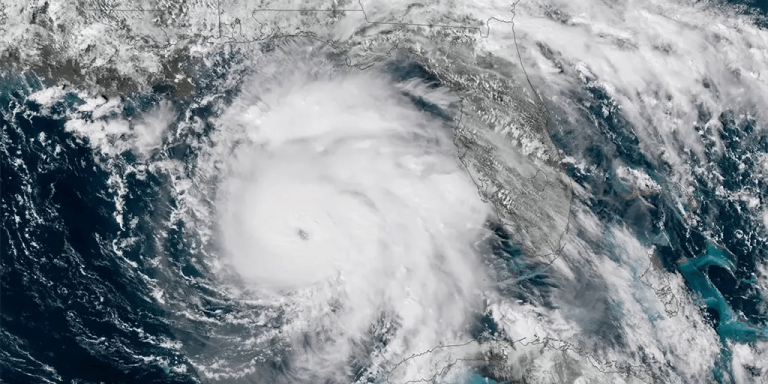
Guest post by Larry Hamlin
Colorado State University global northern hemisphere data for 2024 hurricane season shows The most recent season's accumulated cyclone energy (ACE) was 455.1, which is only 78.6% of “normal” (lower than the 1991-2020 30-year climatological hurricane storm season average of 579.2) The chart below shows data as of December 31, 2024) and is lower than the 2023 value of 636.6 (shown in the table below).
The highest ACE value measured in the Northern Hemisphere ocean between 1991 and 2020 climatology was 880.3 in 1992 (shown in the table below), which is almost double the 2024 ACE measurement.
These results clearly challenge and invalidate decades of flawed and man-made climate alarmist claims that these global storms are growing more powerful due to man-made climate change..

In addition, the latest year-end data (shown below) show measured ACE values and number data for major hurricanes and hurricane outcomes (shown in the table below and the 3 charts below, which show the period 1991 to 2023) 1990 There is no sustained upward trend during the 30-year climate period to 2020.
Furthermore, the table shows that the 2024 values for these measures are significantly lower than the previous highest year measurements (ACE in 2024 is 455.1, compared with 880.3 in 1992, the number of major hurricanes is 17 in 2024, 31 in 2015, the number of hurricanes is 32 in 2024, compared with 44 in 1992) during this climate period. also, The 17 major hurricanes in 2024 exceed the number in the other 18 years of the climatological period The 32 hurricanes in 2024 also exceed the number in the other 19 years between 1990 and 2020.


The above perspective on global Northern Hemisphere climatological consequences for ACEs, major hurricanes, and hurricanes It is also reflected in the climate data of the Northeast Pacific region, Northwest Pacific region and North Indian Ocean region..
These two North Pacific regions have nearly twice the ocean surface area (31.9 million square miles) as the North Atlantic (16 million square miles). Incorporating the northern Indian Ocean region and the two Pacific regions results in Colorado State University's Northern Hemisphere Tropical Cyclone Statistical Analysis shows that the ocean area accounts for approximately 70% of the global ocean surface area for hurricanes in the Northern Hemisphere..
Climate data for these three regions (Northeast Pacific, Northwestern Pacific and North Indian Ocean) are provided below. The 2024 ACE results show that they are well below “normal” values, accounting for only 61.8%, 68.1% and 30.9 respectively from 1991 to 2020. Percentage of climatological average.
The results make a complete mockery of the purely political claims by climate alarmists that man-made climate change is driving increases in hurricane intensity around the world.


Tables are provided below for the Pacific Northeast, Pacific Northwest, and North Indian regions (respectively) from Colorado State University's 1991 to 2020 climatology, which include ACE, major hurricane, and hurricane year outcome data for each region during this period.

Pacific Northeast data shows 2024 ACE, major hurricane and hurricane values significantly lower than previous highest year measurements (82 ACEs in 2024 compared to 294.3 in 1992; for major hurricanes, 3 in 2024 and 11 in 2015; for hurricanes, 5 in 2024 compared to 16 in 2015, 2014 and 1992) during this climate period.

Pacific Northwest data shows 2024 ACE, major hurricane and hurricane values significantly lower than previous highest year measurements (ACEs in 2024 are 204, compared with 570.4 in 1997; major hurricanes are 9 in 2024, compared with 16 in 2015; hurricanes are 15 in 2024, compared with 23 in 1997) during this climate period.

Data from the North Indian Ocean region shows that 2024 values for ACEs, major cyclones and hurricanes are significantly lower than those measured in the previous highest years (For major hurricanes, ACE is 7.5 in 2024 vs 93 in 2019; for hurricanes, ACE is 0 in 2024 vs 5 in 2019; for hurricanes, ACE is 1 in 2024 vs 6 in 2019) during this climate period.
Without elaborating on this point further, the value of ACEs, major hurricanes, and hurricanes As shown above for the data presented for the Northern Hemisphere region as a whole, events in each of the 3 global regions will be exceeded multiple times over the time period through 2024.
Data for the North Atlantic Region ACE for 2024 is provided below, showing a value of 161.6 for this year It exceeds the 1991 to 2020 climatological average of 122.5 and is 31.8% above “normal” values.

this Highest ACE value during climate period The North Atlantic region (see data table below) is 227.1, 226.9, 245.3 and 224.9 occurred in 1995, 2004, 2005 and 2007 respectively.
this The ACE value in 2024 exceeds that of the other 10 years In the climatological period.
this 5 major hurricanes in 2024 that will match or exceed hurricanes in the other 10 years and Up to 7 major hurricanes occurred in 2005 In the climatological period. this 11 hurricanes in 2024 will match or exceed hurricanes in 4 other years during the climatological period The highest value in 2005 was 15.

Climatology data for 2024 compiled by Colorado State University for the North Atlantic region (shown above) shows that there are no record highs in measurements of ACEs, major hurricanes, major hurricane days, hurricanes, hurricane days, named storms or named storm days. Year.
This outcome occurred despite record-breaking hurricane hype from incompetent and incompetent climate alarmist election-year Democratic politicians and the media.
Relevant
Learn more from Watts Up With That?
Subscribe to have the latest posts delivered to your email.
